Computer Plumbing 101: The File Descriptors leak
In my (quite short) experience as a software engineer, I’ve already encountered memory leaks more than once, whether it be my fault (for example when using FastAPI in synchronous mode with a RAM-heavy use case, perhaps this should actually be another blog post altogether) or some third party library’s fault. But I’ve actually grown fond of debugging those, as they’re sometimes the symptoms of bad software design that can be corrected at the same time. This blog post is about the first type of leak I encountered, the one that made me love debugging performance issues (especially lower level ones) : the file descriptors leak.
The Beginning
When working with pdf libraries, or libraries that involve managing resources (especially the ones leveraging bindings with lower level languages) one must be cautious that open resources are actually closed after having been used. Unfortunately, sometimes those libraries are not thread-safe, inducing unpredictable side effects if not managed correctly. Well, this was one of those times. In an early release of the excellent wrapper pypdfium2, the Pdfium library was not thread safe on two functions that I used in my code, and I had absolutely no idea. This code was running under several gunicorn workers in gthread with a lot of threads, and of course, this was the perfect setting for a good old race condition.
At first, I did not understand: the memory kept on growing and I had thoroughly checked that the pdf object (wrapper and raw object) had been closed! But then I let the load test run for a longer period of time, and sure enough I hit ulimit! As I was starting to understand where it could come from, I thought I’d build myself a convenient tool to better identify what was actually happening.
Reproducing the leak
If you want to easily reproduce the leak at home (why would you though ?), here’s a nifty script to do so
import os
import time

if __name__ == '__main__':
    base_path = "path/to/data/folder"
    file_dict = {}
    for file in os.listdir(base_path):
        file_dict[file] = open(os.path.join(base_path, file))
        print("open")
        time.sleep(1)
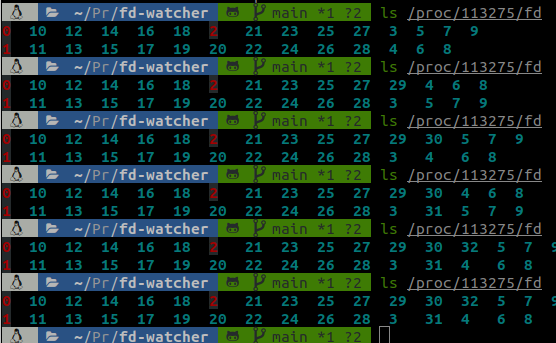
With this script, we can notice a steady increase on the number of file descriptors (the blue numbers on the image):

This is what directly looking in the file descriptors folder of the process looks like
A tailored tool: fd-watcher
Since I thought that this tool should have a minimal time and memory overhead, I thought I’d write it in C. To be frank, this was an excuse to write some C, since I had always been fascinated by this language seeing my father write an absurd amount of code and always complaining about how easy it was to mess things up incredibly fast.
The logic behind this tool is pretty simple: as we suspect that the descriptors are leaking, we need to find a way to see if all descriptors that are open by a process at some point end up being closed. To simplify, we can actually only look at the evolution of the number of descriptors simultaneously opened by a process, and see if this number is increasing (and even exploding if there’s a leak).
To do so, assuming we have sufficient privileges, we can look at /proc/
Ah, I see you wondering: “but wouldn’t it just be ls /proc/<pid> | wc -l in bash Matthias ? Why did you bother to write 500 lines of C for this ?” Well you’re right, but it was fun and actually taught me an awful lot about C and its most incredible friend: stack buffer overflow and gdb.
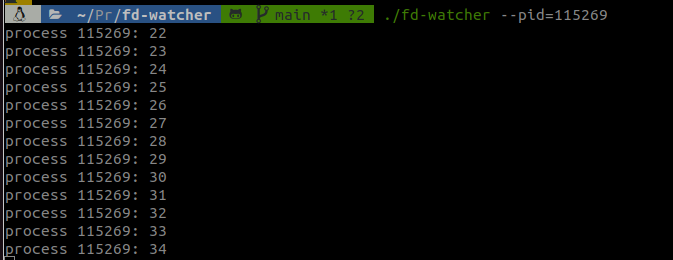
This is what the tool looks like for a leaky process:

Using this tool is extremely simple, you can monitor a process by name or by pid and specify a duration and the interval for the monitoring and it will output the number of opened descriptors in the console.
Future Developments
Being extremely naive and simple in its implementation, it’s not incredibly well coded while being functional, so a little overhaul of the codebase would clearly be nice. Mainly, I think that this tool is missing a graphical/visualization part, especially since it’s interesting to see at what rate the descriptors are leaking to identify the part of the code responsible for the leak. Maybe refactoring the codebase could also be nice, and making it a debian package/adding bindings to a small python package could ease the development and the integration in other monitoring stacks. I’ll try to implement that as soon as I can !
The Grand Finale
When I actually used fd-watcher on my use case and it revealed a gigantic leak of file descriptors, I couldn’t believe my eyes: I had coded something useful for once and it had shown the source of the problem! Then of course the much less flashy part of the work began where I had to put locks before the critical functions, but I was happy anyway.
PS: Please build and share tools even if you think they’re useless, this seemingly little thing is actually the most useful thing I’ve built until now and I’m still using it whenever I have a leak to rule out descriptors.
Check it out if you want !